Anyone who has commissioned a dense phase pressure conveying system knows the move. The line plugs once too often, so the tank pressure gets bumped up a notch. Plugging stops. Everyone relaxes. Then the electricity bill arrives, and the sieve analysis comes back with a fines fraction that was not there before. The line is “stable” now, but it is stable at a worse operating point than the one it was designed for.
The instinct is understandable. Plugging is a hard failure — visible, immediate, expensive. Breakage and energy are soft metrics — they show up at month-end and in customer complaints. So the operator optimizes for the visible failure and accepts the invisible cost. The problem is that the invisible cost is not small, and it is not independent of the fix. On a dense phase system, the same pressure curve that stops the plugging is also the curve that drives energy consumption and particle breakage. You cannot tune one without moving the other.
This is the part of dense phase operation that most discussions skip. Pressure is treated as a single scalar — “set the tank to X bar” — when it is actually a curve with two independent properties. Understanding those two properties is the difference between a line that runs and a line that runs well.
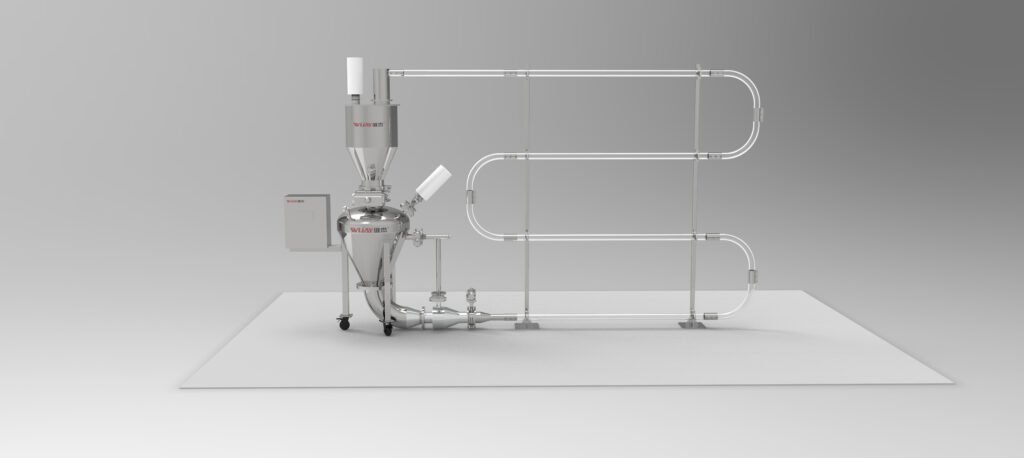
The Pressure Curve Is Two Independent Knobs
When plant personnel talk about “pressure,” they usually mean one number: the tank setpoint. But the pressure state of a dense phase line is a curve over time, and that curve carries at least two independently adjustable pieces of information.
The first is pressure level — the overall height of the curve, the driving differential the line needs to move material at all. It is set by conveying distance, lift height, solids loading ratio and the material’s internal friction. It is largely fixed at the selection stage. Pressure level is a measure of how hard this line is to convey.
The second is pressure waveform — the shape of the curve on the time axis. When does it push, for how long, and when does it stop? A typical dense phase cycle is intermittent: fill, pressurize and push, depressurize, refill. Pressure pulses within each cycle. The same line can be tuned to a sharp, spike-like pulse or to a smooth, broad envelope.
These two properties have completely different engineering meanings, yet they are routinely conflated. And they happen to act primarily on two different outcomes — energy on one side, breakage on the other. That is the key to the whole problem.
Energy Follows the Level; Breakage Follows the Peak
The air-supply energy of a dense phase pressure conveying system is fundamentally about how much air mass is compressed to what pressure and held for how long. Compressor shaft power scales roughly with the logarithm of discharge pressure and with air volume, and air volume is proportional to the cumulative discharge over the conveying cycle. Raise the pressure level and the air-supply power rises with it. That part is physics, and there is not much room to optimize.
The room is in the waveform. On an intermittent pressure-vessel dense phase line, a meaningful share of the gas is consumed outside of useful pushing. During the pressurization phase of each cycle, gas is compressed and stored before it has moved the plug. During the depressurization phase, high-pressure gas that has already done work is vented. If the waveform is a sharp spike, these “dead segments” take a larger share of the total cycle, because the peak arrives and departs quickly and the average useful pushing time is compressed.
In other words, at the same average pressure, a sharper waveform makes the air supply do more useless work. That is the second energy knob.
Breakage follows different logic but points at the same curve. Particle breakage is not primarily caused by “high pressure.” It is caused by localized high velocity. In dilute sections or at bends, particles are accelerated by fast air, strike the pipe wall or each other, and fracture when the impact energy exceeds the material’s strength limit. Impact energy scales with the square of instantaneous particle velocity, not with average line pressure.
So where in the waveform does instantaneous high velocity appear? At the peak. When the pressure pulse rises, the compressed energy stored in the line releases in a concentrated burst, the plug is pushed out abruptly, and local solids velocity spikes well above the average. The same thing happens at plug start-up and on the tail of the pulse, where excess air causes blow-through and dilute acceleration.
The practical conclusion: energy is driven mainly by pressure level and the useful-push fraction of the cycle; breakage is driven mainly by the peak and steepness of the waveform.
Why “Margin on Both Sides” Loses on Both Sides
Put the two curves together and a common industry pattern explains itself: dense phase lines are typically run conservatively, and the cost of that conservatism is paid twice.
The reason is not hard to understand. Plugging is a hard failure — stop the line, open the pipe, clear it by hand, visible loss on the spot. Breakage is a soft metric — a little more fines does not affect delivery this week, and only surfaces when a customer complains or the sieve data goes out of range. To avoid the first, designers and operators add a notch of margin to pressure level and tune the waveform to be more “forceful.”
But the cost is exactly what the two curves predict: raising pressure level moves energy up a monotonic curve; raising the peak moves breakage up past the bottom of its U-shape. Stack the two margins and energy and yield both degrade — while the floor usually only sees the electricity, and attributes the fines anomaly to a material batch or screen wear.
The harder problem is that the two margins feed each other. Lower the velocity to control breakage and the plug becomes less stable, so pressure level gets raised to restore driving force; raise the pressure level and the peak tends to rise with it, and breakage comes back. Manual tuning rarely escapes this loop, because a person can only watch one target at a time, and the feedback cycle is “monthly meter reading” and “customer complaint” — far too slow.
This also defines the limit of field experience. An experienced operator can get a line to “not plug” by giving it enough pressure and a wide safety band. That experience is extremely reliable for stability, but its optimization target is not plugging, not the best combination of energy and breakage. When the raw material batch, moisture or particle size distribution shifts, the experienced solution does not migrate quickly either. This is not a failure of experience. It is that single-point manual adjustment cannot handle two coupled targets at once.
What a Properly Controlled Dense Phase System Does Differently
The direction the industry is moving is point-by-point control of the air injection along the line, optimizing the pressure curve as a shape rather than a setpoint. Two details in that approach matter more than the marketing language.
First, the control target is the feed rate at each injection point, not just total air volume or tank pressure. Dense phase lines often have multiple air injection points — bypass, boosters — along the route. The air admitted at each point determines the transport state of the material in that section. Point-by-point control means the system can suppress the peak locally and add driving force where it is needed — which is precisely the act of refining the waveform knob, rather than crudely raising overall pressure.
Second, the objective is an optimized gas pressure curve without raising air velocity. Translated: hold breakage down without increasing energy, by optimizing curve shape rather than adding air volume. That maps directly onto the two curves described above — it is finding the overlap region where both targets are acceptable.
Why does this have to be done by an algorithm? Because the inputs are real-time, multivariable and coupled. Material conveyability drifts with batch and moisture, pressure response lags, and breakage and energy costs are cumulative rather than instantaneous. A human cannot simultaneously watch two objective curves and continuously adjust multiple injection points. The workload and response speed are not feasible. Algorithms are suited to exactly this class of problem: coupled objectives, time lag, and drift.
A Diagnostic You Can Run Before Any Controls Upgrade
If an intelligent control retrofit is not on the table right now, there is still one thing worth doing today. Record the actual pressure curve and look at it.
Most plants have only a “set pressure” and a “maximum pressure” in their operating data. In practice, installing one pressure transmitter at the pressure vessel outlet and one at the line end, with continuous sampling over a few cycles, produces a real pressure–time curve. Look at three things.
The useful-push fraction of the cycle. What share of the total cycle is actually pushing the plug? If pressurization and depressurization take a large proportion, the waveform has significant dead energy worth optimizing.
The relative height of the peak. How far does peak pressure sit above average pressure? That difference maps directly onto the velocity spike and is the prime suspect for breakage.
The stability of the curve. How well do successive cycles overlap? If variation is large, the match between feed rate and air pressure is already drifting and the manual setpoint is no longer in the optimum region.
None of this requires expensive new equipment. A data logger and one analysis session will show the direction. It cannot replace closed-loop control, but it shows whether the line has room to optimize and on which side — whether the air supply is burning money or the product is being lost in fines.
How WIJAY Approaches Dense Phase Pressure Conveying System Design
On a WIJAY dense phase pressure conveying system, the pressure curve is treated as a design object, not a commissioning leftover. That starts with material characterization — permeability, air retention, deaeration time, cohesion, abrasiveness and breakage sensitivity — because those properties determine whether dense phase is feasible at all and what the pressure envelope should look like.
From there, the air injection strategy, the pressure vessel sizing, the line geometry and the receiver sequencing are specified together so that the waveform can be shaped rather than merely set. Multi-point air injection is used to hold velocity inside the working window along the full line length, including the terminal sections where gas expansion would otherwise drive velocity up and concentrate wear and breakage at the last bends. The receiver is designed with deaeration time in the cycle, so residual fluidization does not carry into the bin and disturb discharge.
WIJAY builds dense phase systems as fully enclosed units from feed point to receiver: dust contained at every transition, low material loss through correctly sized receivers and filters, and automation that ties feed rate, injection control and receiver sequencing into one loop. Positive-pressure and dilute-phase configurations are available where dense phase is not the right route, and the same architecture adapts across industries without re-engineering for every new powder.
The design also accounts for the life cycle that does not appear in the proposal: wear-part access, filter replacement, receiver cleanout and product changeover. That is what keeps a dense phase line at its designed operating point instead of drifting into a conservative, loss-making setting over the first two years of service.
For plants starting a new dense phase line, the first step is material characterization and a pressure-envelope review [internal link: WIJAY dense phase conveying system design]. For existing lines running at a conservative setpoint, the first step is a pressure-curve audit against the material data the line was designed for [internal link: WIJAY conveying system audit and service]. Where automated control and dust containment are production requirements, the conveying system and the automation should be specified together [internal link: WIJAY bulk material handling automation].
FAQ
Why does raising tank pressure on a dense phase system increase both energy and breakage?
Pressure level drives energy consumption monotonically. Pressure peak drives instantaneous particle velocity, and impact energy scales with velocity squared, so a higher peak raises breakage. Raising the setpoint moves both, which is why the two costs appear together.
What is the difference between pressure level and pressure waveform?
Pressure level is the overall height of the curve — the driving differential the line needs. Pressure waveform is the shape of the curve over time: when it pushes, how long, and how it stops. They are independently adjustable and act on different outcomes.
Why is particle breakage described as a U-shaped curve against pressure?
At low pressure the plug is unstable and material moves in bursts, which produces impact and breakage. As pressure rises past the optimum, the peak velocity rises and breakage increases again. The minimum sits between the two failure modes, which is why “more pressure” is not a reliable fix.
Can a dense phase line be tuned by an experienced operator without controls?
An experienced operator can get a line to stop plugging by giving it enough pressure and a wide safety band. That is a stability solution, not an energy-and-breakage optimum, and it does not migrate quickly when the material batch or moisture changes.
What data should I collect before optimizing a dense phase pressure curve?
A continuous pressure–time record at the vessel outlet and line end, over several complete cycles. From that you can calculate the useful-push fraction of the cycle, the peak-to-average pressure ratio, and the cycle-to-cycle stability. Those three indicators show whether the optimization opportunity is on the energy side or the breakage side.
Does a dense phase pressure conveying system always use less energy than dilute phase?
Under comparable conditions, dense phase typically uses 30–50% less air and energy than dilute phase, and elbow life is extended several times over. But that advantage only applies to materials whose permeability and air retention support dense phase. A material that cannot form a stable plug will not deliver the benefit.
CTA
If your dense phase pressure conveying system is running at a conservative setpoint because plugging used to be a problem, the electricity bill and the fines fraction are telling you what that conservatism costs. Send WIJAY the material data, the pressure–time records and the operating symptoms. We will help determine whether the opportunity is in the pressure level, the waveform or the line geometry — and design a dense phase system that holds both energy and product quality, not one at the expense of the other.