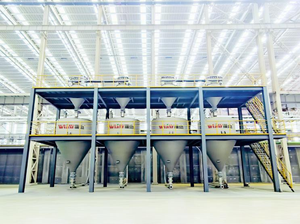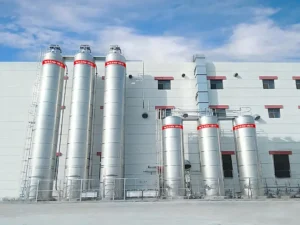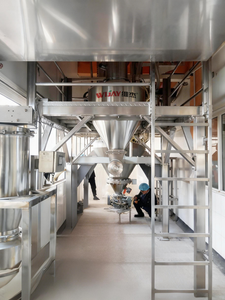
Put two pneumatic conveying system design drawings side by side. One conveys cement, one conveys PET pellets. The tonnage is roughly the same. The pipe diameter is different by a factor of two. One uses a rotary lobe blower; the other uses a compressor and a pressure vessel. Nothing looks wrong, and that is the point. What a pneumatic conveying system looks like has little to do with how much material it moves and almost everything to do with what the material is.
Most design failures do not start with a calculation error. They start with a material assumption that was never tested. The catalog table says “cement, 10–11 m/s.” The project uses that number for a cement blend with a different fine fraction. Commissioning goes smoothly. Six months later the line plugs at the same bend, the elbows wear through, or the filter loads up with fines that were not supposed to exist. The symptom appears at the end of the line. The decision that caused it was made at the beginning, before anyone asked the material what it wanted to do.
The Material Is the First Input, Not the Tonnage
Designing a belt conveyor starts with tonnage and distance. Designing a pneumatic conveying system starts with the material. These two are often confused, and the confusion produces the most common selection method in the industry: pull out a “material–air velocity” table, apply the tonnage and equivalent length, and order equipment.
The problem is that pneumatic conveying is a gas–solid two-phase flow. The same pipe at 30 m/s and at 5 m/s contains two completely different flow regimes, with different pressure-loss behavior, different wear behavior and different plugging probability. The material sets the flow regime. The flow regime sets the pressure loss. The pressure loss sets the air source. Skip any link in that chain and substitute an experience value, and the cost shows up at the end: plugging, worn-through elbows, particle breakage, energy overruns.
Particle Size Distribution: It Sets the Velocity Floor and the Flow Regime
The lower limit in a horizontal run is the saltation velocity — the point where suspended particles begin to settle and form a moving layer on the pipe bottom. The lower limit in a vertical run is the choking velocity — the point where suspension collapses into discontinuous flow. Design values should not run at these limits. The standard practice is to keep 20–30% margin above them. For reference: cement typically needs a minimum conveying velocity around 10–11 m/s, fly ash around 11–12 m/s, and plastic pellets in dense phase can run as low as roughly 3 m/s.
What often decides the behavioral difference is the fine tail at the low end of the distribution. Fine content changes cohesion, permeability, air retention, dust generation and segregation risk. Two materials with the same D50 can behave completely differently: one may support dense phase, the other may require dilute phase. For materials with batch-to-batch variation in fine content, the system margin has to be set by the finest batch, not the average.
There is a second effect that is easy to miss: conveying itself changes the particle size distribution. Abrasion generates new fines, and those fines slow deaeration, increase dust load and worsen downstream segregation. The material to design around is not the material at the inlet. It is the material after a full use cycle.
Permeability and Air Retention: The Real Gate to Dense Phase
The Geldart A/B/C/D classification, published by Derek Geldart in 1973, is the map most powder engineers know. In conveying terms it reads roughly like this: Group A is fine and light, fluidizes well and retains air well — the ideal candidate for sliding-bed dense phase. Group B is sand-like, releases air immediately, and is essentially limited to dilute phase. Group C is cohesive fine powder (titanium dioxide, flour), the hardest to fluidize, but once aerated it retains air extremely well — dense phase is possible but the process is difficult. Group D is coarse particles, naturally suited to plug flow, provided the size distribution is not too wide, or the plug will not hold.
But the map is a first screen, and the exceptions matter. Sand falls into Group A by classification and cannot do dense phase in practice. Fluorspar falls into Group B on the chart and can do dense phase in testing. The alternative approach, developed by researchers at the University of Newcastle bulk solids center, is to stop guessing from particle size and density and directly measure the bulk’s permeability and air retention (deaeration time). Those two bulk properties correlate far more reliably with whether dense phase is feasible and how high the solids-to-air ratio can be pushed. This is why a serious system supplier asks for a sample first. It is not a formality. It is a test that the classification chart cannot replace.
Bulk Density and Solids Loading: The Real Dividing Line Is Not Pressure
Look at bulk density in two values: loose and tapped. Pressure vessel volume and batch size, and the actual discharge per revolution of a rotary valve, hang off the tapped density. The difference between particle true density and gas density determines suspension difficulty — the larger the difference, the higher the suspension velocity required.
Solids loading ratio, not pressure rating, is the dividing line between dilute and dense phase. Dilute phase typically runs 5–15 kg solids per kg air. Dense phase can reach 20–100 or more. A high-pressure compressor running at low concentration is still on the dilute-phase energy curve. The point of dense phase is to move more material per unit of air: under comparable conditions, air consumption and energy are typically 30–50% lower than dilute phase, and elbow life is extended several times over. But that benefit only applies to materials that can do dense phase, and the qualification is issued by the permeability and air-retention data in the previous section.
Flowability and Moisture: Half the Feed-End Problems Start Here
Andrew Jenike’s flow function FFC classifies powder flowability into five bands: FFC ≥ 10 free-flowing, 4–10 easy-flowing, 2–4 cohesive, 1–2 very cohesive, below 1 essentially non-flowing. Materials with a high angle of repose and strong cohesion will not feed through a rotary valve and will bridge at the discharge. The countermeasures are a different feeder type, a pressure vessel with fluidizing pads, or a bin with an arch breaker. In field statistics, feed-end and bin problems usually account for a larger share of downtime than the pipeline itself.
Moisture amplifies every flowability problem. Adsorbed water forms liquid bridges at particle contact points, and cohesion rises sharply. The same batch that plugs in the rainy season and runs fine in dry weather is not an equipment problem. For hygroscopic materials, three things have to be on the drawing: air source dew point control (or nitrogen), line tracing and insulation, and moisture-tight sealing at the bin and feed point.
At the receiving end there is a counterintuitive rule: fluidization in the pipe is a tool; residual fluidization in the bin is an incident. Powder that enters the bin still carrying air has low apparent density and low shear strength, and discharge produces flushing, metering error and fine segregation — all in the window before the air has escaped. Dense-phase systems in particular need to design deaeration time into the receiver cycle.
Abrasion and Attrition: A Mirror Pair, One Strategy
Materials above roughly 4 on the Mohs scale should be designed as wear service: bend radius no less than 5–8 times pipe diameter, ceramic or bi-metal on the first bend and at any reduction, and straight sections built as rotatable components to extend life. In dilute-phase high-velocity service, elbow life on abrasive material is measured in months.
Fragile materials are the mirror problem: crystals, coated particles, tablets, extruded products. Wear and breakage at bends scale roughly with velocity to the 2nd–3rd power, so the order of attack is: reduce velocity first, increase bend radius second, consider dense phase third.
There is a trap that has been validated on a large number of systems: velocity along the line is not constant. Gas expands as pressure drops, and on a single-diameter line the terminal velocity can reach 2–3 times the starting velocity. Wear and breakage concentrate at the last bends. Stepped-diameter piping — increasing pipe size in stages — is the standard method for holding velocity inside the working window. Many systems have a correct starting velocity and fail in the final section.
Static and Combustibility: Parameters Come from Test Reports, Not Experience
Pneumatic conveying is one of the strongest static-charging operations in a plant. For powders with a minimum ignition energy (MIE) below 10 mJ, a single brush discharge is enough to ignite. Full-system grounding (equipment-to-ground resistance within 10⁶ Ω), conductive components and no insulating flanges are requirements, not recommendations.
Explosibility parameters need to be measured as a set: Kst for classification — St1 (≤200), St2 (200–300), St3 (>300) bar·m/s; Pmax, commonly 7–10 bar for organic powders and higher for metal powders; MIT (dust cloud) and LIT (dust layer), which set equipment surface temperature limits; MEC, typically 20–60 g/m³ for organic powders. Only particles below 500 µm count as combustible dust, and below 75 µm is the most violent — and fines are exactly what concentrate in the filter. The filter is the first component to protect in the explosion-protection chain.
These parameters directly determine hazardous-area classification (Zone 20/21/22), vent area (EN 14491 / NFPA 68), whether suppression is required, whether a rotary valve can be counted as an explosion-isolation device, and whether inerting is needed (LOC sets the oxygen concentration limit). The frameworks in GB 15577, NFPA 652/660 and EU ATEX are aligned: test first, then design. Designing without testing is designing blind.
Many plants that have had incidents believed beforehand that their material was “not combustible in bulk, so the dust must be safe too.” Flour, sugar powder, milk powder, polymer powder and API powders are all on the dust explosion incident list. Bulk safety does not equal dust safety.
Before the Design, There Has to Be a Table
The following list can go directly to a testing lab, or be used to check what data a supplier has asked for.
| Parameter | Common method | Directly determines |
|---|---|---|
| Particle size distribution D10 / D50 / D90 | Laser diffraction | Velocity floor, explosion classification, segregation assessment |
| Loose / tapped bulk density | Graduated cylinder / tap density tester | Pressure vessel volume, feeder volumetric efficiency |
| Particle true density | Pycnometer | Suspension velocity, pressure loss |
| Angle of repose, FFC, cohesion | Shear testing | Feeder type, arch breaking, bin cone angle |
| Permeability, air retention (deaeration time) | Bulk solids testing | Dense-phase feasibility, solids loading limit |
| Moisture content, hygroscopicity | Karl Fischer etc. | Air dew point, tracing, sealing |
| Mohs hardness / abrasion index | Scratch / abrasion testing | Pipe material, bend type |
| Breakage sensitivity | Drum / impact testing | Velocity ceiling, dilute or dense phase |
| MIE, Kst, Pmax, MIT, LIT, MEC | 20 L sphere, Hartmann tube | Full explosion protection scheme |
| LOC (when inerting is required) | 20 L sphere | Nitrogen protection concentration |
The cost of this testing is typically one to two percent of the project budget. The common consequence of skipping it is 30–50% of the project budget in remediation during commissioning — a ratio that has been validated repeatedly across the industry.
After the table is filled, one step remains: pilot testing. Every empirical formula is built on “some form of some material.” None of them was written for your material. The only way to pin down the minimum velocity, solids loading and pressure loss for a new material is to run it through a pilot loop that can reproduce the actual line geometry — straight runs, bends, reductions and vertical lifts. When evaluating suppliers, whether they have a pilot loop, and whether that loop can be reconfigured to your layout, is worth more attention than the unit price on the quotation.
What This Means for Pneumatic Conveying System Design at WIJAY
The difference between the cement system and the PET pellet system is not the designer’s skill level. It is that material properties pushed two different technical routes to their respective endpoints. Good pneumatic conveying system design is not about which pressure-loss formula was chosen. It is about whether the designer treated “what the material is” as a question to be tested or a question to be assumed.
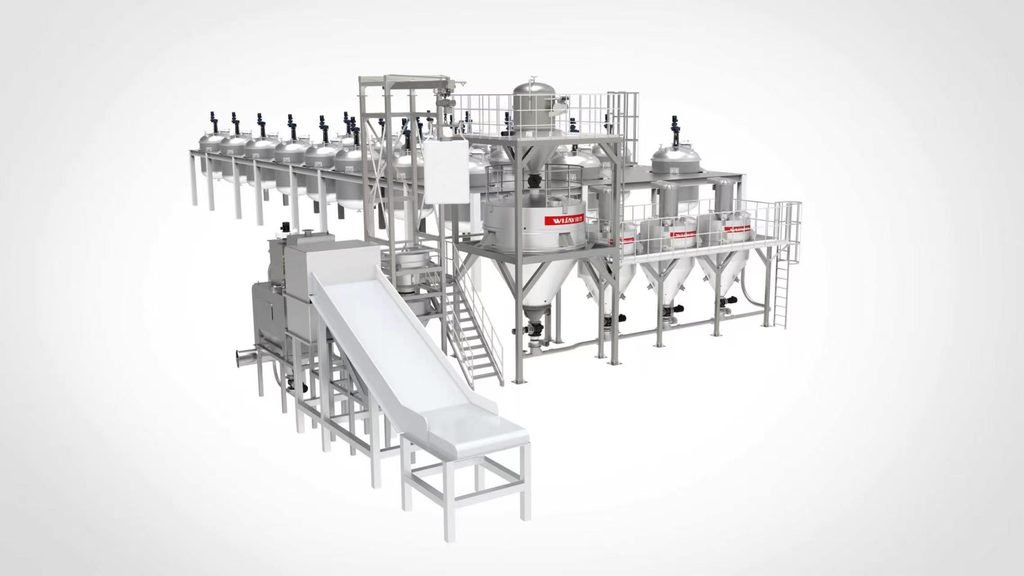
WIJAY approaches pneumatic conveying system design from the material side first. That means material characterization before equipment selection: particle size distribution, loose and tapped bulk density, permeability and deaeration behavior, shear and flowability data, abrasiveness and breakage sensitivity, and the full explosibility set where combustible dust is present. The blower, feeder, line, receiver, filter and controls are then selected together against that data and against the plant’s real load profile — not against a catalog table.
The system-level view produces equipment that works as one boundary: fully enclosed conveying from feed point to receiver, dust contained at every transition, low material loss through correctly sized receivers and filters, and automation that ties feeder speed, air supply and receiver sequencing into one control loop. Positive-pressure and dilute-phase configurations handle long-distance and high-capacity duty. Dense-phase configurations are applied only where the permeability and air-retention data support them. Custom layouts accommodate multi-point loading and discharge, and the same architecture adapts across industries without re-engineering the line for every new powder.
WIJAY also designs for the part of the life cycle that does not appear in the proposal: wear-part access, filter replacement, receiver cleanout and product changeover. That is what makes a system a long-term asset rather than a project that has to be re-solved every time the product changes.
For plants starting a new line, the first step is material characterization and a load-profile review [internal link: WIJAY pneumatic conveying system design]. For existing lines that plug, wear or lose capacity, the first step is a boundary audit against the material data the line was actually designed for [internal link: WIJAY conveying system audit and service]. Where dust containment and automated material flow are production requirements, the conveying system and the automation should be specified together [internal link: WIJAY bulk material handling automation].
FAQ
Why does pneumatic conveying system design depend more on material than on tonnage?
Because pneumatic conveying is a gas–solid two-phase flow. The same pipe at different velocities contains different flow regimes with different pressure-loss and wear behavior. The material sets the flow regime, the flow regime sets the pressure loss, and the pressure loss sets the air source. Tonnage sets the scale; material sets the architecture.
Can I use a standard material–velocity table for a new powder?
A table is a starting reference, not a design basis. Two materials with the same D50 but different fine content can require different conveying phases. The fine tail drives cohesion, permeability and dust load, and batch-to-batch variation means the margin should be set by the finest batch.
Why can’t I tell whether dense phase is feasible from a Geldart classification?
The Geldart chart is a first screen and has well-known exceptions — sand classifies as Group A but cannot do dense phase; fluorspar classifies as Group B but can. Direct measurement of permeability and air retention (deaeration time) correlates far more reliably with dense-phase feasibility and the achievable solids-to-air ratio.
What causes elbows to wear through in months instead of years?
Velocity, impact angle and particle hardness. Wear and breakage scale roughly with velocity to the 2nd–3rd power. On a single-diameter line, gas expansion can push terminal velocity to 2–3 times the starting velocity, concentrating wear at the last bends. Lower velocity and stepped-diameter piping are the primary countermeasures.
Do I need a full dust explosibility test set for a material that is not combustible in bulk?
Yes, if the material can exist as a fine dust. Flour, sugar, milk powder, polymer powder and many API powders are on the dust explosion incident list despite being non-combustible in bulk form. MIE, Kst, Pmax, MIT, LIT and MEC determine the hazardous-area classification, vent area, isolation method and whether inerting is required.
Why is pilot testing necessary if all the material data is available?
Because empirical formulas are built on some form of some material, not on yours. Pilot testing on a loop that reproduces the actual line geometry is the only way to pin down the minimum velocity, solids loading and pressure loss for a specific material before committing to the full system.
CTA
If you are starting a pneumatic conveying system design and the material data is still a catalog table, start there. Send WIJAY a sample and the operating requirements — tonnage, distance, layout and any known hazards. We will help characterize the material, determine whether dilute or dense phase is the right route, and design a fully enclosed system that matches the powder you actually run, not the one on the datasheet.